Desmos: An Easy and Powerful Online Tool for Graphing and Visual Representations of Mathematics
Big Picture/Overview
Desmos is a free and public-benefit online tool that makes it easy to generate and modify visual representations of mathematical formulas (aka, graphs). It amalgamates and extends the functionality of earlier versions of similar learning technologies like graphing calculators, chart generators, and touch-screen recording devices. Students and instructors find it user-friendly and able to produce complex representations in little time.
As a teaching tool:
When you need to generate visual demonstrations, whether as finished products or as unfolding processes, Desmos enables you to do so in a way that provides consistent, well-crafted, malleable, and usable output that is easy to share with students. And they can use what you share in several flexible ways.
As a learning tool:
Students can use Desmos to solve problems, explore concepts, produce illustrations as part of larger assignments, or just play with math in order to develop more intuitive understandings of the ways formulaic expressions relate to spatial manifestations.
One of the most important advantages of Desmos is that it prioritizes accessibility. The visualizations it generates are designed to be accessible for students with different kinds of visual, tactile, and other disabilities in ways that exceed the capabilities of fixed-print forms and mechanical devices.
Note: Due to vendor settings identified during the security review process, it is important to encourage students to follow two practices when using Desmos:
- It is important that anyone who creates a Desmos account generate a secure password (at least 8 characters, containing 3 character sets [upper case, lower case, numerals, and special characters]) and update their login information every 180 days.
- Be sure to log out and close the browser after using Desmos if you are using a device that other people also use.
When to Use Desmos: Situations and Use-cases
Desmos may be an option any time you or your students need to generate a visualization of a mathematical principle, especially if it will be helpful to interact with that illustration dynamically. If any of the following situations, apply, then Desmos might be a good tool for your teaching:
- if, in a classroom, you would normally draw a graph on a chalkboard or dry-erase board
- if, when presenting materials or designing a quiz or homework, you would normally paste a screenshot or a video recording of a drawing of a graph
- if, when building course materials, you might normally use other tools (such as Mathematica or Geogebra) which Ohio State has not vetted for accessibility or privacy
- if, as part of projects or advanced assessments, you ask students to incorporate graphs and figures (and where generating those visualizations is not itself the primary learning objective)
- if, in any kind of learning situation, you find yourself saying words like "think about what the relationship between those variables would look like..." or "how does that change? Let's draw it..."
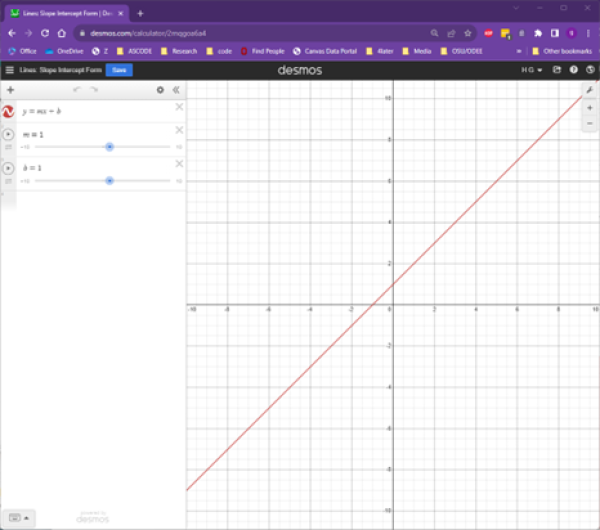
This widget provides a very basic illustration of what an embedded Desmos graph might look like in your course. Click anywhere on the red line to see coordinates appear.
Some of the features that set Desmos apart from similar tools include:
- Quick and Easy Graph-building: The Desmos interface is intuitive and efficient. Suppose you are writing an introduction to a specific kind of function, and you just need to show what the curve looks like in a graph in a Carmen Page or a powerpoint. Desmos has rendered this process intuitive and simple to use, making it a fast and easy way to generate a visualization, which can then be shared directly or embedded into any online page or document.
- Complex Layering: Desmos allows users to create and modify multiple layers on the same graph, including through the use of parameters and overlapping variables, so that it is possible to generate complex and dynamic visualizations. This feature set makes it easy to illustrate change by varying parameters, adding and removing variations, shading the differences between curves, and other methods.
- Focused Formatting Options: Desmos offers a limited set of configuration options for the look and feel of graphs, such as color, the presence or absence of labels, line thickness, and background grids.
- Interactivity and Dynamic Exploration: In conjunction with parameters, Desmos enables the use of lists and tables, so that it is possible to generate multiple variants of a graph. Desmos also enables the use of sliders, so that you and/or students can interact with visualizations by varying parameter values and seeing immediate updates.
- Easy Linking With Carmen and Other Course Materials: Once you have developed a visualization, it is relatively simple to create a link to it and/or to embed it directly into a Carmen Page, Quiz, etc., or most file types. As long as students have a network connection, they can see the visualization.
How to Use Desmos: Design and Implementation Considerations
To begin using Desmos in your class, follow these few, simple steps:
1. Create an Account
a. Go to desmos.com
b. Click on "Log in" at the top right of the screen
c. In the pop-up window, click on "New to Desmos? Sign up!"
d. Make sure to generate a secure password (at least 8 characters, containing 3 character sets [upper case, lower case, numerals, and special characters])
2. Create a Graph
a. The Desmos Users Guide provides an efficient, illustrated overview of the basics.
b. The Graphing Calculator page in the Help Center provides a thorough overview of all the features and options.
3. Save the Graph
a. Use the save button and/or
b. Click the pull-down arrow to the right of the graph name to rename or duplicate the graph
4. Share and Use the Graph (in one of three different ways)
a. as a Hyperlink
i. Click on the Share button
ii. Copy the text of the link to your visualization
iii. Paste that link wherever you would like to share it with users
b. as an Embedded, Interactive Widget (in Carmen)
i. Click on the Share button
ii. Click on the Embed button/link to generate a bit of code (the embed code)
iii. Copy that code
iv. Switch to Carmen (or the application where you want the embedded, interactive version to appear)
v. In any place in Carmen where the rich text editor appears (on Pages, Quiz prompts and questions, Assignment prompts, Discussion prompts, etc.), follow these directions to use the Embed tool.
vi. Note: You may be able to embed Desmos graphs in other online systems.
c. as a Static, Image-file
i. Click on the Share button
ii. Choose Export Image
iii. Set your preferred options on the subsequent popup window
iv. Click Download PNG -- and then save the file in a place and with a name you will remember
v. Note: Saving the graph as an image removes interactivity and makes the resulting file much less accessible for people with disabilities. Whenever possible, we recommend linking to or embedding your graphs.
5. Be sure to log out and close the browser after using Desmos if you are using a device that other people also use.
For information on the Desmos Classroom online tool for building interactive and social graph-based assignments, please follow the link below.